Metrics for Object Detection
Introduction
Summarize some most used metrics for object detection.
Concept
Confidence score is the probability that an anchor box contains an object. It is usually predicted by a classifier.
Intersection over Union (IoU) is defined as the area of the intersection divided by the area of the union of a predicted bounding box $(B_p)$ and a ground-truth box $(B_gt)$ :
$$
IoU = {area(B_p\cap B_gt)\over area(B_p\cup B_gt)} \quad (1)
$$
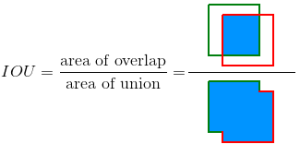
Fig.1
as Fig.1 show
Both confidence score and IoU are used as the criteria that determine whether a detection is a true positive or a false positive. A detection is considered a true positive (TP) only if the predicted class matches the class of a ground truth and the predicted bounding box has an IoU greater than a threshold $(e.g., 0.5 ... 0.95)$ with the ground-truth.
Precision is defined as the number of true positives divided by the sum of true positives and false positives:
$$
precision = \frac{TP}{TP + FP} \quad (2)
$$
Recall is defined as the number of true positives divided by the sum of true positives and false negatives. Note that the sum is just the number of ground-truths, so there’s no need to count the number of false negatives:
$$
recall = \frac{TP}{TP + FN} \quad (3)
$$
precision-recall curve, which indicates the association between the two metrics. Fig. 2 shows a simulated plot.
Fig 2
Definitions of various metrics
This section introduces the following metrics: average precision (AP), mean average precision (mAP), average recall (AR) and mean average recall (mAR).
Average precision
Although the precision-recall curve can be used to evaluate the performance of a detector, it is not easy to compare among different detectors when the curves intersect with each other. It would be better if we have a numerical metric that can be used directly for the comparison. This is where average precision (AP), which is based on the precision-recall curve, comes into play.
AP can then be defined as the area under the interpolated precision-recall curve, which can be calculated as:
$$
AP = \sum_{i = 1}^{n - 1} (r_{i + 1} - r_i)p_{interp}(r_{i + 1}) \quad (5)
$$
Mean average precision
The calculation of AP only involves one class. However, in object detection, there are usually $K>1$ classes. Mean average precision (mAP) is defined as the mean of AP across all $K$ classes:
$$
mAP = \frac{\sum_{i = 1}^{K}{AP_i}}{K} \quad (6)
$$
Average recall
Like AP, average recall (AR) is also a numerical metric that can be used to compare detector performance. In essence, AR is the recall averaged over all $IoU \in [0.5, 1.0]$ and can be computed as two times the area under the recall-IoU curve:
$$
AR = 2 \int_{0.5}^{1}recall(o)do \quad (7)
$$
where $o$ is IoU and $recall(o)$ is the corresponding recall.
COCO challenge’s metrics
the COCO challenge defines several mAP metrics using different IoU thresholds, including:
- $mAP^{IoU=.50:.05:.95}$ which is mAP averaged over 10 IoU thresholds (i.e., 0.50, 0.55, 0.60, …, 0.95) and is the primary challenge metric;
- $mAP^{IoU=.50}$ which is identical to the Pascal VOC metric;
- $mAP^{IoU=.75}$ which is a strict metric.
0 Comments